 tesserae
solutions
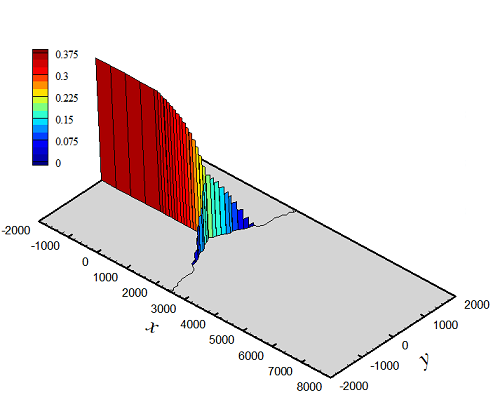
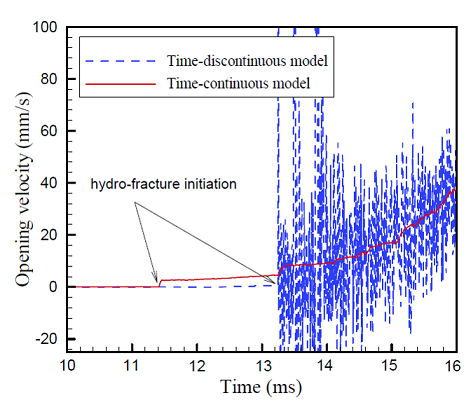
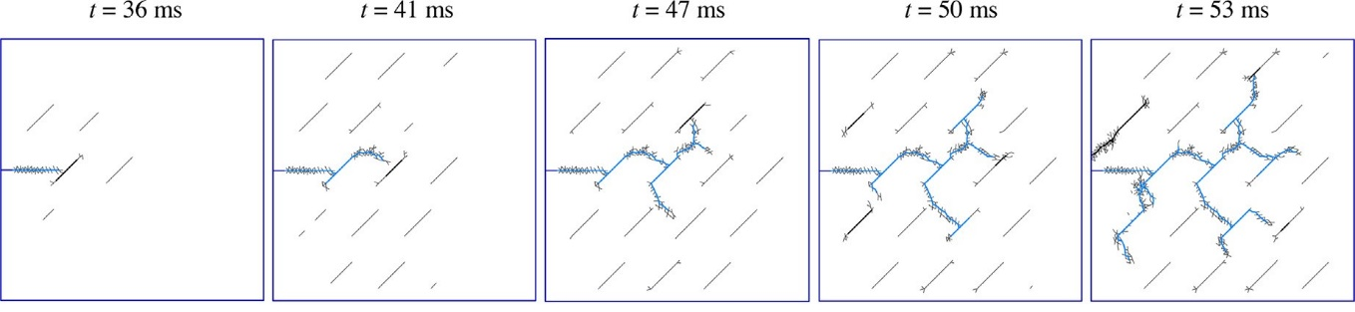
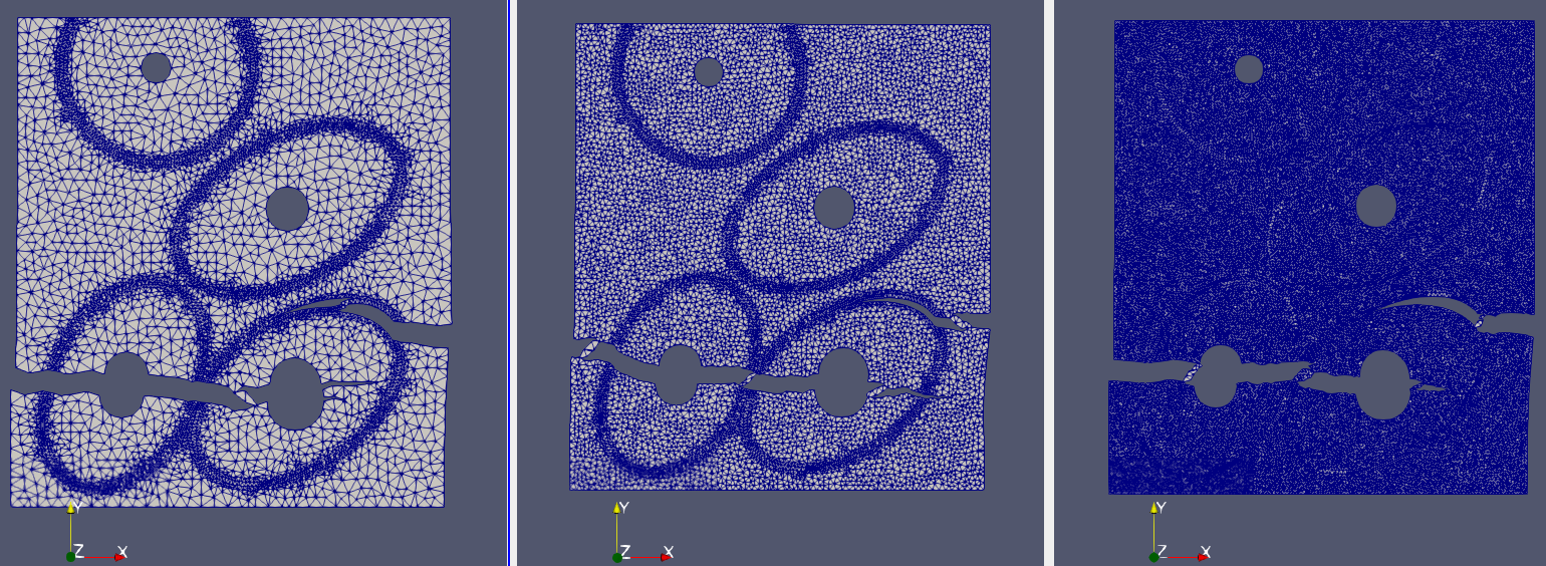
Hydraulic fracture trajectories obtained for hydro-fracture propagation in cemented naturally fractured block. Top left figure shows contours of water pressure; top right figure compares opening velocity for our method versus time-discontinuous method; bottom figure shows crack propagation in naturally fractured media.
| Experiment | Simulation | |
|---|---|---|
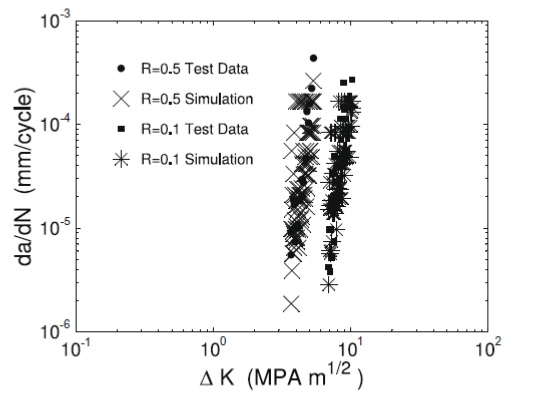
| R=0.1 | 570,830 | 579,000 |
| R=0.5 | 705,440 | 737,000 |
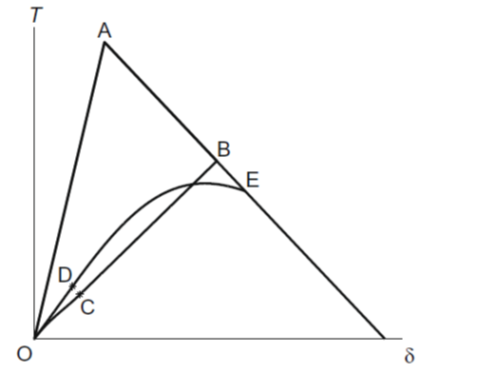
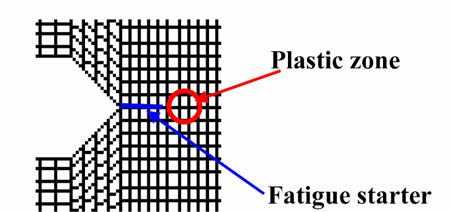
A fatigue model based on cohesive-zone modeling and damage variables is illustrated in the top left. When tested computationally on a notched specimen shown in the lower left, the results closely match a laboratory experiment as shown on the right. We also developed a simple but effective extrapolation scheme that is able to reproduce laboratory experiments in the high-cycle regime, as shown in the above table.
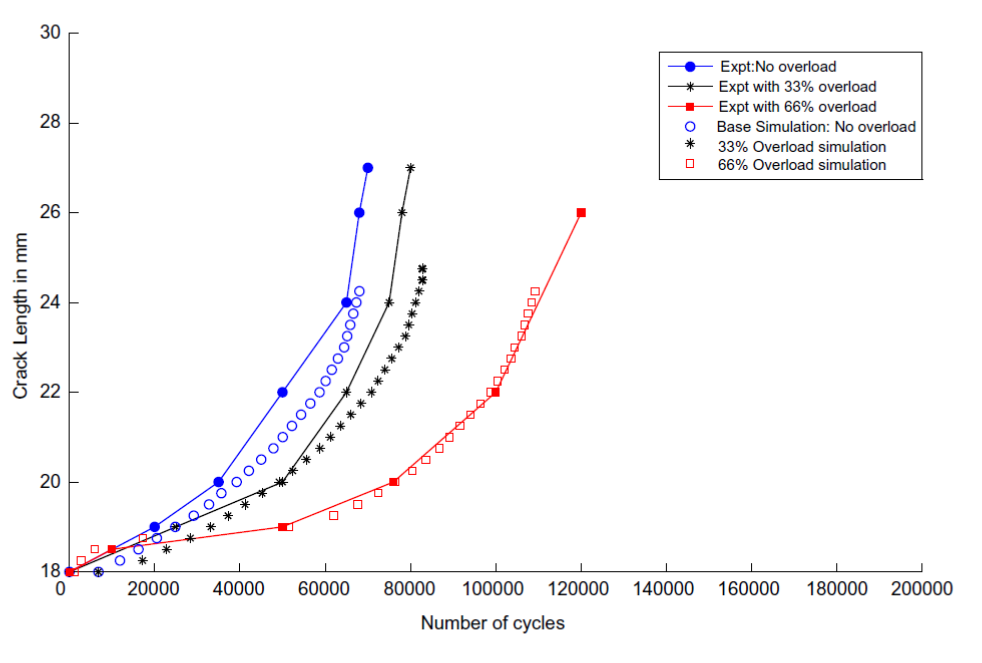
The above graph shows a computational experiment that reproduces a known fatigue effect in which the fatigue crack growth is retarded following a single peak overload. Our model captured the effect that larger overload increases the degree of retardation.
Convergent crack propagation solution in microscale osteonal structure of femur bone.
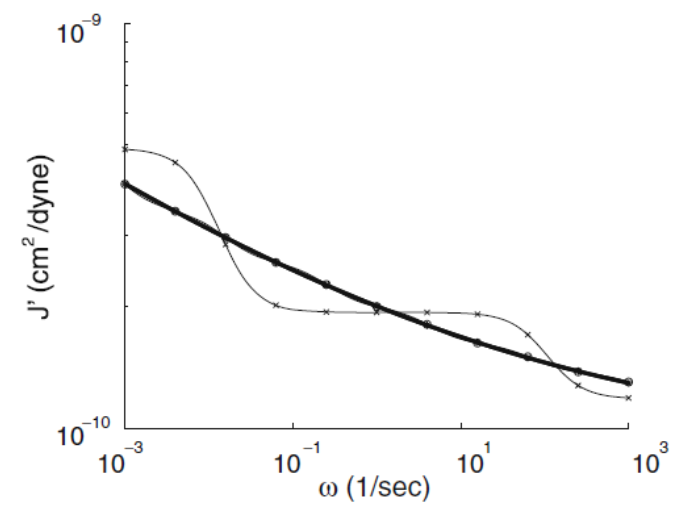
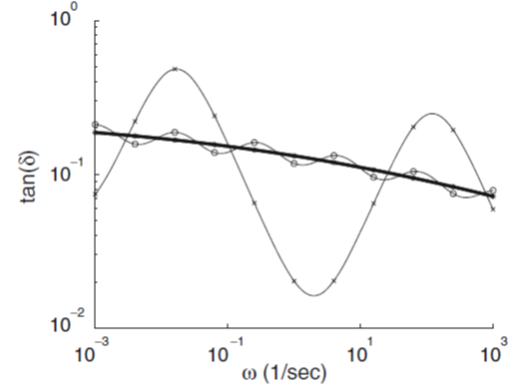
Storage compliance (J') and loss tangent (tan δ) fitted to polyethylene data. Three, nine, and twenty seven rheological units approximation (the latter is not discernible as it matches the data exactly) without increase of model parameters. Fit is performed for a chosen frequency range and is not valid outside of it.